

What the figures showed
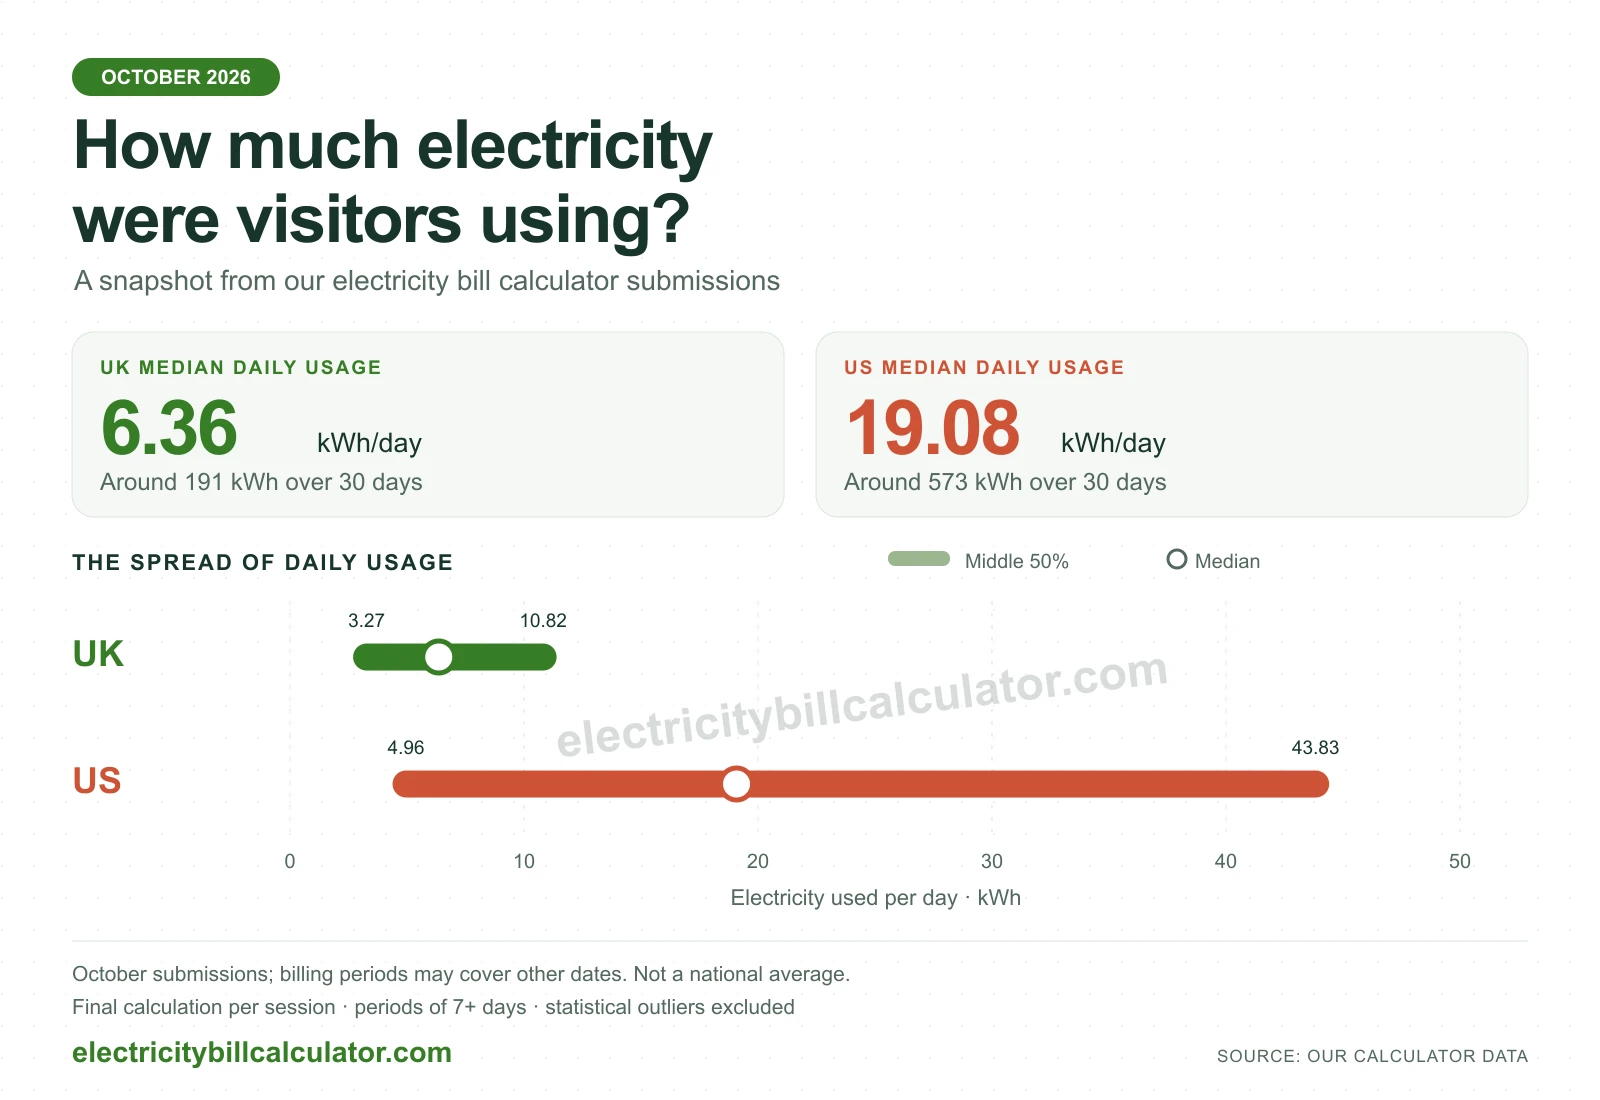
We looked at the UK and US calculators separately. Because visitors entered bills covering different lengths of time, we worked out a daily figure for each calculation first. Someone entering a quarterly bill could then be compared fairly with someone entering a monthly one.
The median is the halfway point: half the retained calculations were below it and half were above it. We've used it here because a few very large entries can pull an ordinary average upwards.
| Result after filtering | UK calculator | US calculator |
|---|---|---|
| Median daily usage | 6.36 kWh | 19.08 kWh |
| Middle half of daily usage | 3.27–10.82 kWh | 4.96–43.83 kWh |
| Median usage expressed over 30 days | 191 kWh | 573 kWh |
For the UK calculator, the middle half of the results fell between 3.27 and 10.82 kWh a day. That spread is a useful reminder that there isn't one daily figure that fits every home.
The 30-day figures in the table are daily usage multiplied by 30 and rounded to the nearest whole kWh, rather than measured monthly totals.
How we tidied up the data
If you've ever changed a reading or checked a different tariff in a calculator, you'll know how easy it is to run several calculations in a row. We kept the final calculation from each browser session, separately for the UK and US, so those repeat attempts didn't get extra weight.
We also left out zero-usage entries and periods shorter than a week. A brief reading interval can be useful for checking a particular day, but it may tell us less about someone's usual electricity use.
Finally, we applied a statistical outlier rule to daily usage in each market. For this analysis, that excluded figures above 29.54 kWh a day in the UK and 151.84 kWh a day in the US.
High usage doesn't automatically mean an entry is wrong. A home with electric heating, for example, may use much more electricity than another property. The filter helps us describe the centre of this dataset; it doesn't decide what a household should be using. It also can't catch every typing error or test entry, particularly very low positive values.
How the method affects the result
We checked how the UK median changed when we adjusted the shortest billing period we'd include, recalculating the outlier limits each time.
| Minimum billing period | Median daily usage | Equivalent over 30 days |
|---|---|---|
| One day | 6.34 kWh | 190 kWh |
| Seven days, used for the headline | 6.36 kWh | 191 kWh |
| 28 days | 5.87 kWh | 176 kWh |
Including periods shorter than a week made very little difference. Looking only at periods of at least 28 days brought the figure down to 176 kWh over 30 days, so the choice of billing period does have some effect.
Removing outliers also changed the result. Before that step, the UK median for periods of at least seven days was 7.40 kWh a day, compared with 6.36 kWh afterwards. These are filtered figures, and that choice matters when reading them.
Comparing the figures with your own usage
Take the electricity used on your bill, in kWh, and divide it by the number of days it covers. If you used 300 kWh over 30 days, for example, that's 10 kWh a day.
You can then compare that with the figures above, while keeping your own circumstances in mind. Property size, how many people live there, electric heating and solar panels can all affect the comparison. The dates your bill covers matter too.
If your usage is higher or lower, that alone doesn't tell you there's a problem. These results describe what visitors entered into our calculator; they aren't a target for your home.
About the data
We analysed calculator submissions made during October 2026, using Europe/London time, on 2 November 2026. Stored records begin on 2 October, so the first day of the month isn't covered. The original database entries haven't been changed.
For reproducibility, we retained the last entry in each session and market, ordered by submission time, calculation sequence and record ID. We then excluded zero usage and periods under seven days before applying the outlier filter once. Each remaining session carried equal weight.
The outlier filter uses the distance between the 25th and 75th percentiles, known as the interquartile range. Its limits are the lower quartile minus 1.5 times that range and the upper quartile plus 1.5 times that range, with a lower limit of zero. All excluded outliers were above the upper limit. This follows the fence rule described in the NIST statistical handbook. Our quartiles use linear interpolation at index (n − 1) × p in sorted values.
Estimate your electricity bill
Enter your own readings, billing period and tariff rates to see how your electricity usage adds up.
Sources
Usage figures come from our production calculator records, analysed on 2 November 2026. The filtering method is explained above